


EXECUTIVE SUMMARY
Talk of the next U.S. recession has made headlines in recent months, particularly as the yield on 10-year Treasuries briefly dropped below that of 3-month Treasuries. This “inversion” of the Treasury yield curve—a favored recession indicator for U.S. banks—has historically signified that a U.S. recession could begin within one or two years. This indicator is not as useful as it once was, however, owing largely to impacts from the Federal Reserve’s (Fed) quantitative easing programs.
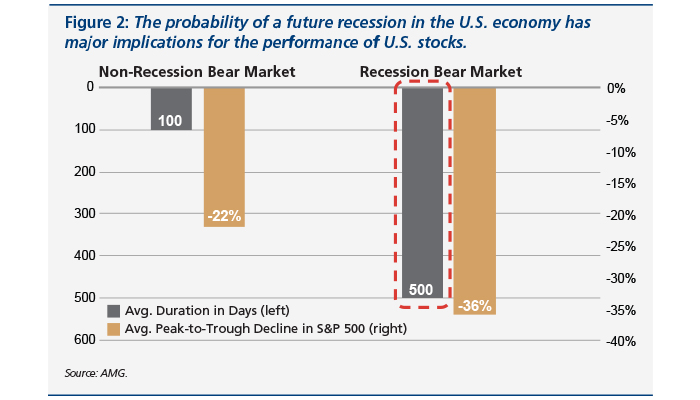
The probability of a recession has major implications for the U.S. economy and financial markets. Stocks in particular are negatively impacted by recessionary environments, with S&P 500 recessionary bear markets lasting five times as long as their non-recessionary counterparts.
There are a variety of economic measures that act as leading indicators for overall economic growth and recessions. Many of these relate to the key drivers of consumer spending—namely employment, consumer confidence, and lending conditions. While some of these key leading indicators suggest that risks to future consumer spending and economic growth have increased, none are at levels that preceded prior U.S. recessions.
Going forward, the path of the U.S. economy and financial markets depends largely on the policies and actions of the Fed. As long as inflation remains benign, monetary policymakers can continue to support the economy by keeping interest rates low. However, the strength of the U.S. labor market and higher discretionary spending by the federal government suggest that inflationary pressures may increase. If this occurs, the Fed might have to raise interest rates more rapidly than currently anticipated, which would likely put the brakes on economic growth. Therefore, while the U.S. economy currently remains healthy, the potential for rising inflation also poses a moderate risk to the outlook.
DANGER AHEAD FOR THE U.S. ECONOMY?
In late March 2019, the yield on long-term (10-year) U.S. Treasury notes briefly dropped below that of short-term (3-month) Treasury bills. Typically, this “inversion” of the 10-year – 3-month Treasury yield curve reflects pessimism about the outlook for the U.S. economy, and is often favored by banks as an indicator of future recessions1 (Figure 1).
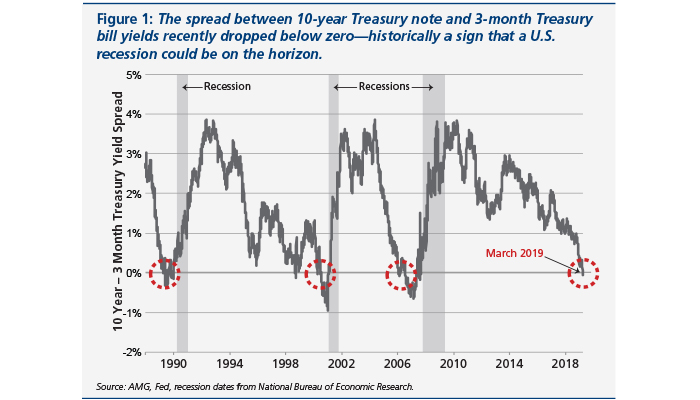
The 10-year – 3-month Treasury yield spread indicator is likely not as accurate or effective as it once was, however. Between 2008 and 2014, the Fed engaged in multiple rounds of quantitative easing, purchasing trillions of dollars of long-term Treasury securities in order to reduce long-term interest rates and stimulate economic growth. These purchases reduced the yields on long-term Treasuries like the 10-year note by 0.5 to 1.5 percentage points by most estimates,2,3,4 while having little to no direct impact on the yields of short-term Treasuries like the 3-month bill. As a result, the spread between the 10-year and 3-month Treasury yields has also likely been artificially suppressed by as much as 0.5 to 1.5 percentage points.
Demand from foreign buyers may also have played an important role in pushing down long-term Treasury yields relative to short-term yields. Foreign investors have been attracted to U.S. debt in recent years due to near-zero or negative government bond yields in other major developed countries and strong appreciation of the U.S. dollar. In fact, by the end of 2018, foreign investors held nearly 40 percent of all publicly available U.S. Treasury securities.5 Further, as of June 2018, over 88 percent of the U.S. Treasuries held by foreigners had original maturities of more than one year.6 This means demand from foreign investors has had a much greater downward impact on long-term Treasury yields than on short-term yields, and has also likely contributed to a smaller yield spread between 10-year and 3-month Treasuries.
Implications for Financial Markets
Questions of the 10-year – 3-month Treasury spread’s current validity—and the likelihood of a U.S. recession—have major implications for the outlook for the economy and financial markets. Recessions typically lead to millions of Americans losing their jobs and a slowdown in earnings growth for workers. Output shrinks and falls below the economy’s actual productive capacity. Companies fail, and banks restrict lending to protect themselves from losses, which in turn reduces the credit available to consumers and other businesses. Many of these negative impacts can also take years to reverse.
As a result, an impending U.S. recession or the lack thereof has significant implications for domestic financial market performance. During recessionary periods, government bonds, precious metals, and other “safe haven” assets can perform relatively well, but riskier asset classes like stocks often suffer large declines. For the benchmark S&P 500 U.S. stock index, the severity of bear markets—periods when the index declines by 20 percent or more from its most recent peak—depends largely on whether or not the U.S. economy enters recession.
As Figure 2 illustrates, S&P 500 bear markets that occur outside of recessions tend to be relatively mild and short lived, with an average peak-to-trough price decline of 22 percent and an average duration (time between peak and trough) of about 100 days.7 S&P 500 bear markets that occur during recessionary periods tend to be more severe and much longer lasting than their non-recessionary counterparts, with an average peak-to-trough decline of 36 percent and an average duration of about 500 days.
KEY LEADING ECONOMIC INDICATORS
Fortunately, the 10-year – 3-month Treasury spread is not the only indicator that can help determine whether or not a U.S. recession is imminent. Other economic indicators, particularly those related to the key underlying drivers of consumer spending, can also help shed light on the outlook for the U.S. economy.
As of 2018, consumer spending—represented by real, inflation-adjusted personal consumption expenditures—accounted for nearly 70 percent of total U.S. gross domestic product (GDP).8 Consumer spending’s share of GDP has also been steadily increasing since the early 1950s, which means its importance to the U.S. economy continues to grow. By observing the forces that drive consumer spending—namely employment, consumer confidence, and lending conditions—it is possible to identify additional key leading indicators that suggest when a future U.S. recession is becoming more likely.
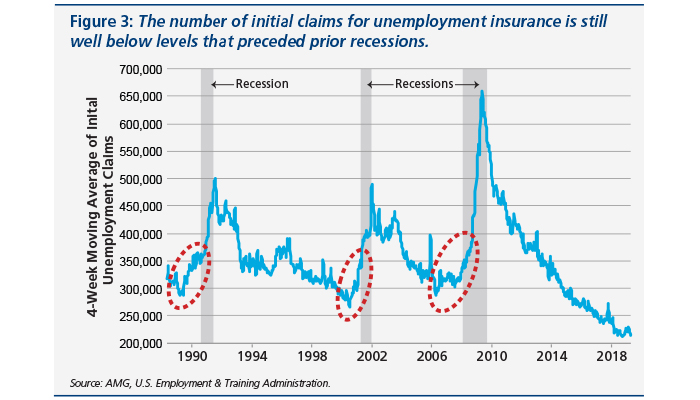
In terms of employment, one of the best leading indicators of the future health of the U.S. economy is the number of initial claims for unemployment insurance. As shown in Figure 3, sustained increases in the four-week moving average of initial unemployment claims are a sign that a U.S. recession could be on the horizon. While this key measure has plateaued since 2018, it remains near historical lows and is currently showing no signs of distress in the U.S. labor market or the economy as a whole.
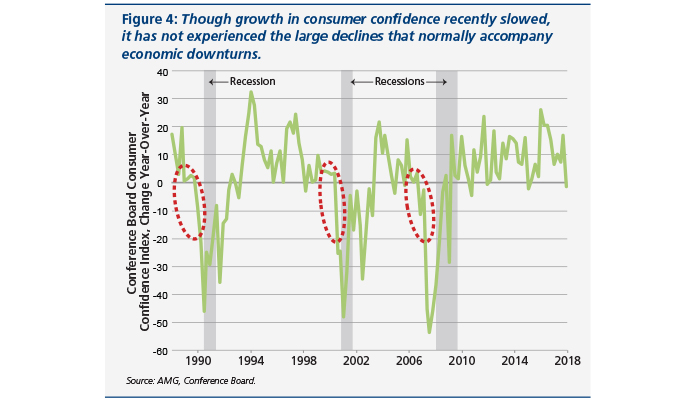
Consumer confidence is also crucial to the health of consumer spending and the U.S. economy. Significant year-over-year declines in the Conference Board’s Consumer Confidence Index, for example, have historically been a reliable leading indicator for lower consumer spending and economic growth (Figure 4). This measure shows that growth in U.S. consumer confidence slowed recently, but also that the growth rate remains well above levels that accompanied past recessions.
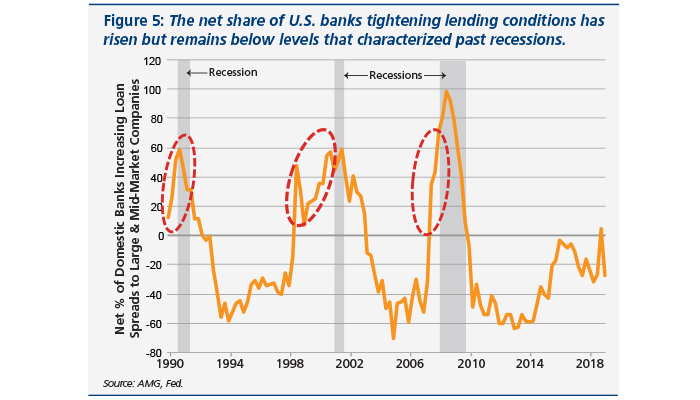
On the lending side, a good indication of banks’ willingness to extend credit is the net share of domestic banks increasing loan rate spreads to large and middle-sized corporate borrowers. When this share rises, it signifies that banks are tightening overall lending conditions for U.S. borrowers, which is often a precursor to slower consumer spending and economic growth. As Figure 5 illustrates, the share of banks tightening lending conditions has moved up from its post-crisis lows but has not yet reached levels that would signal danger for the U.S. economy.
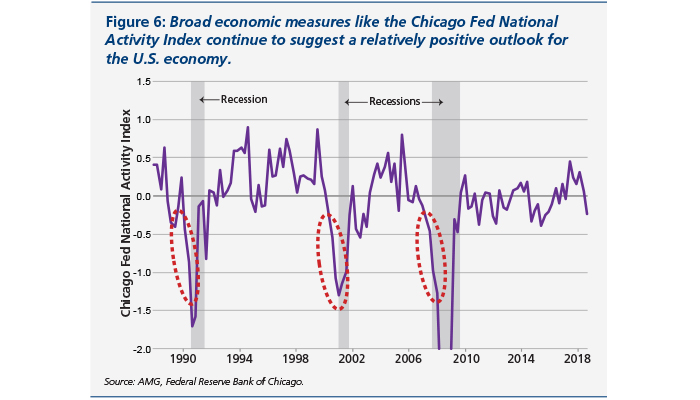
Broad measures of U.S. economic activity such as the Chicago Fed National Activity Index (CFNAI) can also be useful in anticipating where the U.S. economy is headed. The CFNAI is a weighted average of 85 monthly indicators of U.S. economic activity ranging from payrolls to industrial production.9 Large negative values in the index are evidence that the aggregate economy is decelerating, and that a recession may be coming. Though the CFNAI declined in late 2018 and early 2019, it currently remains well above levels that preceded past downturns (Figure 6).
IMPACTS OF FED POLICY & INFLATION
While the key leading indicators mentioned here show that the U.S. economy remains healthy and that no recession is imminent, they also suggest that the probability of a mild slowdown or soft patch in the near future has risen. Going forward, the strength of the U.S. economic expansion will depend largely on how policymakers at the Fed are able to deal with any such slowdowns and the degree to which they can continue to support future economic growth.
Policymakers at the Fed affect the U.S. economy primarily by manipulating interest rates. The Fed sets short-term interest rates by establishing the rates at which banks lend to one another on an overnight basis,10 and as mentioned can also impact longer term interest rates by adjusting its holdings of long-term Treasury securities. Collectively, these programs help determine the interest rates—and the availability and affordability of credit—for all U.S. borrowers.
At several times in post-WWII history, the Fed has been able to engineer “soft landings” for the economy and avoid recession by pausing or slowing interest rate increases.11 The recent bear market in U.S. stocks from late September to late December 2018 is another example, as it was ended at least in part by Fed policymakers’ decision to pause future interest rate hikes. When inflationary pressures are modest—as they are today—the Fed has the ability to pursue such actions to support the economy and financial markets. However, if inflation accelerates, the Fed may have less of an ability to step in to support the economy.
For most of the post-Great Recession recovery period, U.S. inflation has remained below the Fed’s target level of two percent,12 which has allowed policymakers to keep interest rates historically low in order to encourage credit growth and consumer spending. Several factors suggest that the situation in the United States may soon change, however. For one, most economists agree that the labor market in the United States is at or near “full employment,” meaning there are few workers available relative to the number of job openings. In this environment, average wage growth for U.S. workers should continue to accelerate,13 which may lead to higher price inflation. Further, the federal government recently added considerable fiscal stimulus to the economy in the form of stepped up discretionary spending and tax cuts, which can also lead to higher inflation in the late stages of the economic cycle.
Global inflationary pressures may be set to increase as well. In recent years, inflation around the world has been held back by recurring crises in Europe and emerging markets, disinflationary impulses from China’s ongoing restructuring efforts, lower oil prices, and a significant increase in the value of the U.S. dollar. Going forward, however, China will likely stimulate its economy in response to slowing cyclical growth, which could lead to higher growth and inflation across emerging markets.14 Oil prices continue to rebound from the significant declines suffered in 2014-2016, increasing inflationary pressures globally. And if the U.S. dollar reverses course and weakens against other currencies, it will drive up U.S. import prices, which could also lead to higher domestic inflation.
Regardless of how inflationary pressures might manifest, history shows that U.S. monetary policy takes effect only after long lag times—in many cases as much as a year or more.15 That means policymakers at the Fed have to raise interest rates preemptively to stave off higher inflation, and generally cannot afford to wait for price pressures to rise before taking action. Therefore, if inflation in the United States does rise materially, the Fed may have to raise rates abruptly and more rapidly than currently anticipated. This event could push the economy into recession, and would also likely have a significant negative impact on U.S. stock prices.
AMG believes the U.S. economy is healthy and will avoid recession for the time being, but will continue to monitor any potential risks that could impact the outlook for the U.S. economic expansion.
Ask your AMG advisor for more information on how AMG’s economic insights and investing strategies help keep your portfolio prepared throughout changing economic and market environments.