


Updated: February 19, 2021
The higher stock prices have climbed from the spring 2020 selloff, the more clients have been asking: Is this a bubble?
Bubbles are never truly identifiable until they’re over, yet today’s investing environment is characterized by such extreme divergences among asset classes and industry sectors that it is entirely possible for us to be in one. What to do? History tells us that investors can mitigate the chance of being hurt when lofty expectations and valuations revert and can seize the potential of today’s unloved securities becoming less so by practicing the time-honored strategy of diversification.
A VISUAL COMPARISON OF TODAY VERSUS HISTORY
* See notes at bottom of this article.
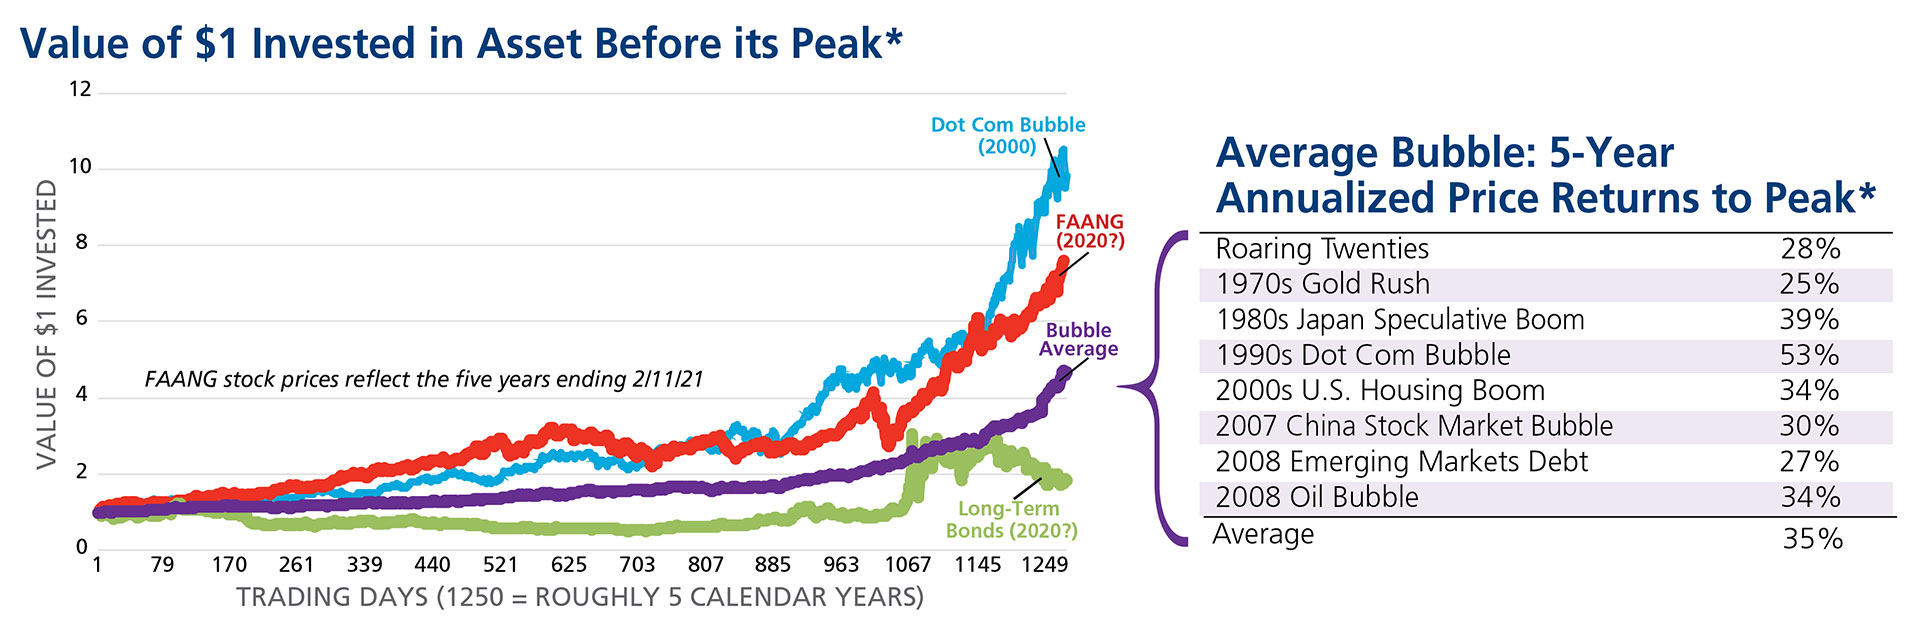
In the chart above, we looked at seven historical periods of market over-exuberance and averaged their stock price returns. Although the average annual gain of 35% looked enticing, the peak to trough losses ranged dramatically from 60–80% over the subsequent two to three-year period. Investors who put money in at the top lost much of it.
Over the last five years, the New York Stock Exchange FANG+ Stock Index, which provides exposure to 10 highly traded tech giants, appreciated 35% annually while the average stock, as measured by the Value Line Geometric Index, returned 0%, on a price return basis. The divergence between the valuations of a handful of high-growth companies and the rest of the stock market presents both challenges and opportunities for investors.
HOW TO RESPOND?
AMG doesn’t recommend making abrupt moves, however, we do suggest tilting portfolios away from the possibility of a bubble in high-growth U.S. stocks. We believe investors are extrapolating their high earnings growth unrealistically far into the future and may be disappointed when a broad-based economic recovery in 2021 likely accelerates the earnings of companies more tied to the economic cycle as well as foreign stocks.
As the global economy recovers over the next few years, high-growth stocks may lose two very important tailwinds.
First, loose monetary policy has injected an incredible amount of money into the financial system, causing investors to chase the same assets and depressing long-term bond yields. High-growth stocks are expected to generate most of their cash flows way out in the future and so are the longest duration equity assets. As bond yields dropped, so did the discount rate applied to value these future cash flows, increasing their present value. The FANG+ stocks are now trading at 55.5x price-to-earnings, based on the last 12 months’ earnings. Although we expect rates to stay low for some time, they’re not likely to trend lower as the economy recovers. This will force investors to rethink the valuation they are willing to pay for future growth and cash flows, likely leading to lower valuations.
Second, the 2020 economy was characterized by immobilized consumers, which benefited less economically sensitive sectors like technology, effectively shifting their future growth and earnings forward to today. As vaccines mobilize the economy and encourage spending outside of the home, we expect a broad range of companies to benefit. In fact, value stocks are expected to report higher earnings than growth stocks as the economy accelerates in 2021.
While these future headwinds for growth stocks are unlikely to “pop” any bubbles, we do think the expected earnings acceleration of value stocks and high current valuations of growth stocks warrants overweighting value stocks in the coming year. A similar argument can be made in favor of non-U.S. stocks, which also have lagged lately.
DIVERSIFICATION AND AVERAGING
Today’s lofty growth-stock valuations and the increased concentration of market indices—the top six companies represent nearly 25% of the S&P 500 Index—can make it psychologically challenging for those with a large amount of new money to invest. Yet studies suggest that timing the market is difficult if not impossible. Instead, AMG recommends clients stick to the long-term strategic asset allocation constructed to meet their needs. Most often the right mix of asset classes includes a significant allocation to global equities—not just large-cap growth stocks or the S&P 500. Whether we are in a bubble or not, investors are likely to benefit in the long run from the capital appreciation that global equities offer versus bonds or certainly cash.
For the skittish, AMG recommends averaging-in over several months and allocating the first tranches to the most undervalued areas of the market that offer the highest potential for future appreciation, which today are U.S. value stocks and foreign stocks.