


EXECUTIVE SUMMARY
The post-Great Recession economic expansion has been defined by low hourly pay increases for the average worker. Hourly wage growth has been stuck below 2.5 percent year-over-year since 2010, compared to an average of 3 to 4 percent during the economic expansions of the 1990s and 2000s.
The debate continues as to how wage growth has managed to remain so low since the recession despite strong job growth and a steadily falling unemployment rate. AMG’s research suggests that the aging of the U.S. labor force, involuntary part-time employment, and job creation centered in low-paying industries have all played a role in holding back wage growth in recent years.
At the same time, alternative measures of wage increases—such as weekly and inflation-adjusted earnings growth—show a much stronger post-crisis trend than the conventional hourly metrics. Median weekly earnings growth, for example, recently returned to near pre-recession peak levels.
Another alternative wage growth measure is the Atlanta Federal Reserve’s Wage Growth Tracker, which has followed labor market changes since 2010 more closely than many other indicators. Based on the Wage Growth Tracker’s relationship with the unemployment rate and the general availability of jobs, it appears earnings growth could be due for a significant acceleration.
In terms of monetary policy, the U.S. Federal Reserve (Fed) uses the Employment Cost Index as one of its primary measures for wage growth. The Employment Cost Index’s private wages and salaries component has been steadily accelerating since 2010 and has picked up pace since 2016. This improvement supports the Fed’s plans for continued interest rate increases, and could lead to a faster pace of rate increases than currently anticipated as policymakers attempt to stay ahead of inflationary pressures.
IMPACT OF DEMOGRAPHICS AND UNDEREMPLOYMENT
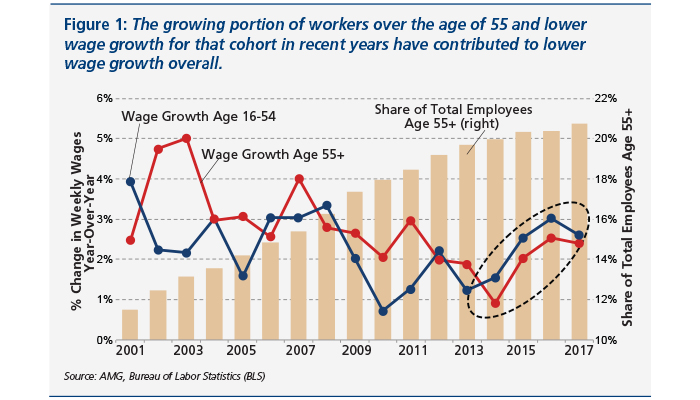
In the years during and immediately following recessions, older employees often enjoy faster wage growth than younger workers. The opposite is true in late-cycle expansion periods (like the current one), when younger employees generally see faster wage growth. In five of the last six years, workers age 16 to 54 had faster median weekly earnings growth than workers over the age of 55. At the same time, the share of workers over the age of 55 rose from about 19 percent in 2012 to nearly 21 percent in 2017 (Figure 1). As a result, the rising share of older workers has played a role in holding back wage growth in recent years, and may remain an issue for as long as the economic expansion continues.
Another hallmark of the post-crisis recovery has been unusually high levels of involuntary part-time employment, or employees who would like to work more hours but more hours are not available. Research has shown that part-time employees have much lower wage growth on average than their full-time counterparts,<1> and thus high levels of part-time employment can exert a significant drag on overall wage growth. While the rate of involuntary part-time employment has now largely returned to pre-crisis levels, it had a negative impact on wage growth over much of the post-crisis recovery period.
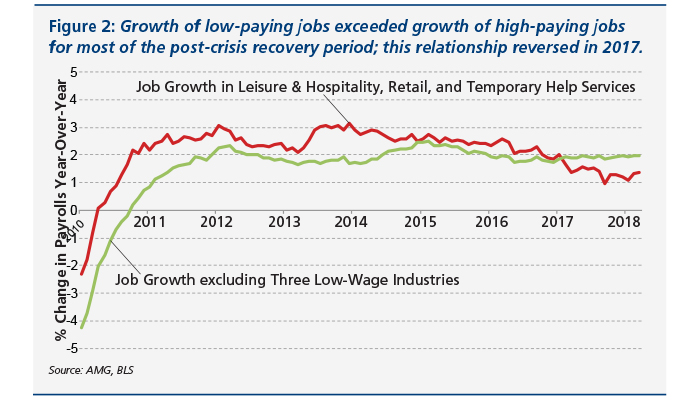
Further, job creation since the beginning of the recovery has favored low-paying occupations. From 2010 to 2017, the rate of growth in low-paying industries like leisure and hospitality, retail, and temporary help services outpaced that of other industries on average (Figure 2). This trend contributed both to higher levels of involuntary part-time employment and to lower overall wage growth. In early 2017, the growth rate of higher-paying jobs eclipsed that of lower-paying jobs for the first time since the end of the financial crisis. The last two times this reversal occurred, during the economic expansions of the 1990s and 2000s, average hourly wage growth accelerated by nearly one percent shortly afterward.
INSIGHT FROM WEEKLY EARNINGS
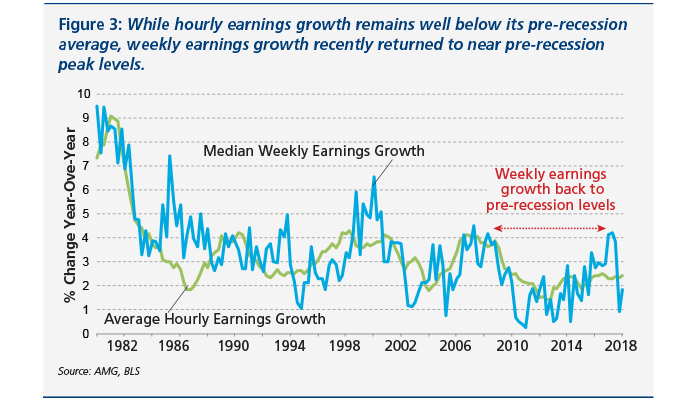
While conventional measures of wage growth tend to be on an hourly basis, weekly earnings (hourly earnings x average hours worked per week) are more useful for judging workers’ spending power and the potential for inflationary pressures. The average number of weekly hours workers receive ties to the U.S. economic cycle: weekly hours tend to plunge during recessions but increase during economic expansions. As a result, it is not uncommon for hourly wage growth to understate the actual amount of take-home pay workers receive in the late stages of an economic cycle (like today).
As Figure 3 shows, weekly earnings growth has significantly outpaced hourly earnings growth for much of the past two years. In fact, weekly earnings growth returned to pre-recession peak levels in 2017, even as hourly earnings growth remained well below its pre-recession average.
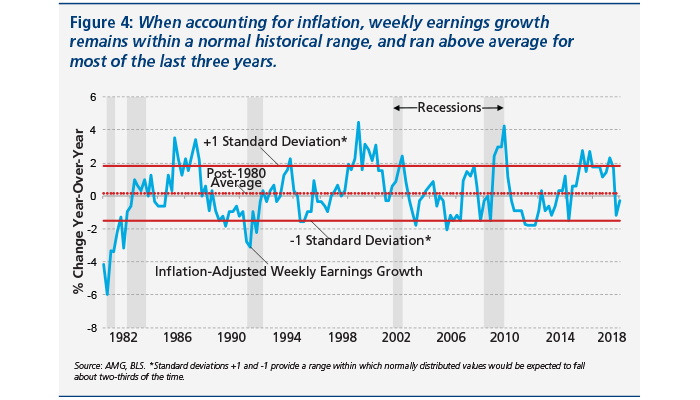
Another way to look at what U.S. workers actually gain in terms of spending power is to adjust weekly earnings growth for the rate of inflation. With high inflation, workers require larger pay increases to maintain their spending power, but with low inflation lower wage growth is required.
As Figure 4 illustrates, weekly earnings growth in inflation-adjusted terms has remained within a relatively narrow historical range since 1980. By this measure, recent wage growth has not been unusually low as many hourly measures have suggested, but actually is in line with historical norms. Inflation-adjusted weekly earnings growth was also positive from 2015 to 2018, meaning workers were able to increase their spending power as inflation remained subdued.
KEY LABOR MARKET INDICATORS POINT TO WAGE ACCELERATION
Another way to evaluate wage growth is the Federal Reserve Bank of Atlanta’s Wage Growth Tracker (WGT). The WGT measures the median percent change in the hourly wage of specific individuals observed one year apart. It has been credited with following changes in underlying labor market factors (like the unemployment rate) more closely than other measures of wage growth.
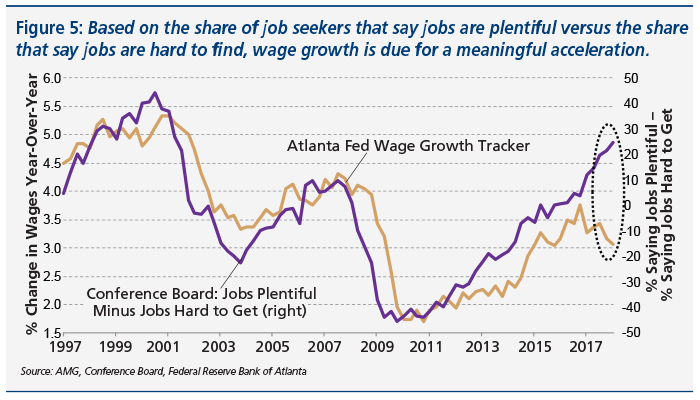
The WGT has a strong relationship with the availability of jobs, the rate at which workers are leaving their jobs for other positions, and a variety of other labor market factors. However, few indicators are as telling as the Conference Board’s ratio of survey recipients saying jobs are plentiful to those saying jobs are hard to get. A higher ratio means there are more available open positions per available worker, which puts workers in higher demand and exerts upward pressure on wage growth.
As shown in Figure 5, the Conference Board indicator had a very strong association with the WGT from the time of the WGT’s inception in 1997 until the relationship between the two broke down in 2017. According to this indicator, wage growth as measured by the WGT should be much higher than it is today, and could be due for a meaningful acceleration.
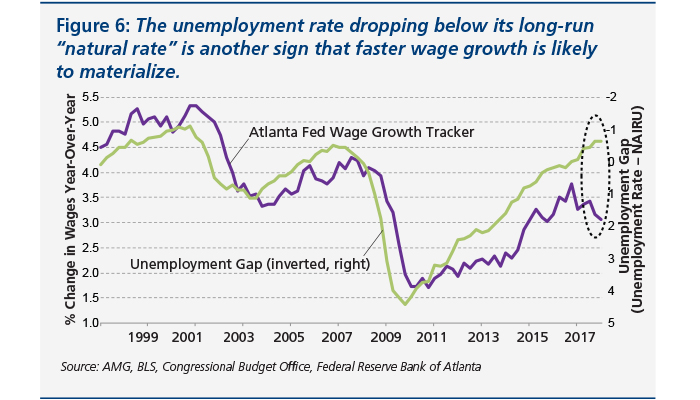
The WGT also has a close historical relationship with the unemployment rate, and particularly with the gap between the unemployment rate and its “natural rate.” The natural unemployment rate, also known as the Non-Accelerating Inflation Rate of Unemployment (NAIRU), is an estimate of the unemployment rate below which inflation pressures begin to materialize.
At 4.1 percent, the average unemployment rate for the first quarter of 2018 was well below the 4.7 percent currently estimated by the Congressional Budget Office (CBO) for the long-term natural rate of unemployment. This negative gap between the unemployment rate and the natural rate means that inflation and wage growth pressures are likely to increase. Historically, there has been a strong relationship between the unemployment gap and the WGT (Figure 6). Like the Conference Board indicator, the unemployment gap suggests that wage growth as measured by the WGT could be due for a significant acceleration.
FOCUS ON THE FED’S PREFERRED MEASURE
Prior Fed chair Janet Yellen has stated that in setting monetary policy the Fed favors the Employment Cost Index (ECI) as its primary measure of wage growth. As a quarterly figure, the ECI tends to be less volatile over time. The ECI also encompasses both salaries and benefits for both private and government workers, making it a relatively comprehensive measure of overall employment costs.
The wages and salaries component of the ECI, particularly the one focused on workers in the private sector (i.e. non-government), gives a good sense of national wage pressures and the trend of wage growth. As illustrated in Figure 7, the private wages and salaries component of the ECI has been steadily increasing since 2010, and has been above its historical average since 2016. The measure’s rate of acceleration also appears to have stepped up since 2016.
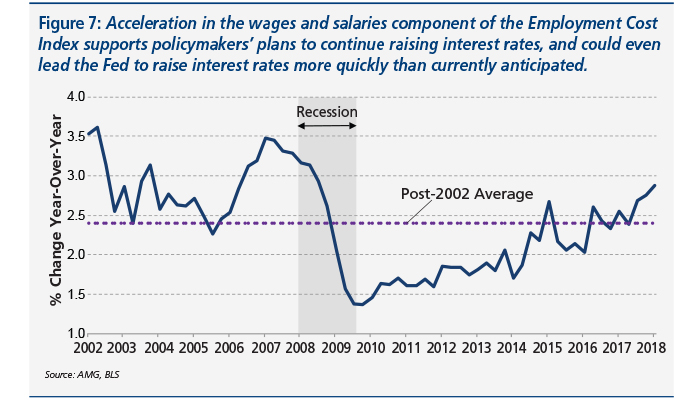
The steady uptrend of the ECI’s private wages and salaries component, its recent acceleration, and the fact it has reached pre-recession levels should support Fed policymakers’ plans for continued interest rate increases. In fact, if the wages and salaries component of the ECI continues to grow strongly, the Fed may need to step up its pace of rate increases. Policymakers raise interest rates preemptively in order to stay ahead of inflation, and rapid wage growth is a warning to the Fed that inflation may get out of hand. As a result, if growth in the ECI continues to accelerate, policymakers could decide to increase interest rates more quickly than currently anticipated.
INVESTMENT IMPLICATIONS
If the Fed is able to raise interest rates gradually and in concurrence with a strengthening economy, the impact on financial markets may be mild. If the Fed is forced to raise rates more quickly than expected, however, it could have a negative impact on both stocks and bonds.
One concern has revolved around short-term interest rate increases from the Fed playing a role in “flattening the yield curve,” or pushing short-term interest rates closer to the level of higher long-term interest rates. An inversion of the yield curve—when short-term interest rates move higher than long-term interest rates—almost always portends an economic recession.
It is important to note, however, that long-term interest rates are determined largely by investors’ expectations for growth and inflation. Higher expectations for growth and inflation result in higher long-term interest rates. Thus, if the Fed raises short-term interest rates in conjunction with an improving economy and higher inflation expectations (which the labor market and wage growth suggest should be the case), then long-term rates will move higher and the flattening of the yield curve will happen much more slowly.
Further, periods like today when the yield curve is close to flat but not inverted tend to be highly favorable for the stock market. Since 1976, the S&P 500 has gained an average of 13 percent over the following year when the spread between the 10-year and 2-year Treasuries is between zero and one percent, as it is today. When the spread is greater than one percent, the S&P returns about eight percent the following year on average, and when the spread is negative the S&P returns about five percent on average.
Regardless of the pace, current labor market and wage growth conditions warrant further increases in interest rates. In a rising-rate environment, bonds and bond proxies like Utilities stocks are unlikely to fare well as rising interest rates and higher inflation make fixed payments from bonds and dividend-paying stocks less attractive to investors.
Within equities, certain sectors may stand to benefit from the rising-interest rate environment. Financial companies such as banks are able to earn more money from loans as interest rates increase, for example. If increases in interest rates coincide with stronger economic growth, growth-sensitive industries like Materials and Industrials could stand to benefit as well.
As long as policymakers at the Fed raise interest rates commensurate with increases in economic growth and inflation expectations, the economy and the stock market can continue to perform well. However, investors should be aware that faster wage growth poses a risk to the pace of Fed policy tightening, and that a faster pace of interest rate increases could have a negative impact on both stock and bond markets.