


EXECUTIVE SUMMARY
The United States Labor Force Participation Rate (“LFPR”) is projected to decline over the next two decades as the baby-boomer generation retires. The United States needs to add 12 million additional workers to return the LFPR to the rate historically needed to keep GDP growth at or above 3%. The long-term downward trends for both women and prime-age men must be mitigated or reversed to help offset this decline, as LFPR is crucial for growth in the economy via growth in the labor force.
Key issues for keeping women in the labor force are closely related to childrearing, and the United states should take note of recent developments in Japan where mandated maternity-leave and easier access to daycare have increased female LFPR that surpasses the United States.
The decline in LFPR for prime-age men is a longer trend and is closely related to increasing job polarization and increasing access to leisure and disability benefits. Boosting aggregate growth in the economy, increasing access to education and training, and reforming parts of the disability program could be good starting points in mitigating this trend.
For the United States to sustain GDP growth at or above 3% in the coming decades, the gap in the LFPR should be addressed through some combination of incentives, tax cuts and policy prescriptions that get workers off the sidelines. The Trump administration has already made efforts in this direction by cutting taxes and supporting job-training programs, but more can be done to maximize the effectiveness of the American labor force.
OLDER WORKERS
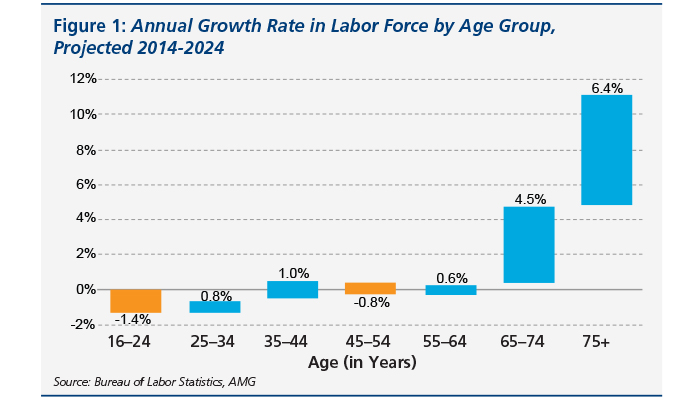
The coming situation for older workers in the United States seems like a paradox on first review. While the retirement of the baby-boomer generation is expected to drive the LFPR down overall, the 65-75 age group is expected to grow the fastest of any other age group in the labor force during the next decade (Figure 1). This means that as a proportion of the population, more people aged 65-75 will be joining the labor force than in any other age cohort over the next decade, despite being past traditional retirement age. This is due to a multitude of factors, including increased life expectancy, insufficient retirement savings and declining participation in other age groups (discussed in later sections). Nonetheless, the 65–75 age group that joins the labor force will not even come close to offsetting the number that will retire, and it might be worth considering how to keep some of the retirees at work.
Policy Implications for Older Workers
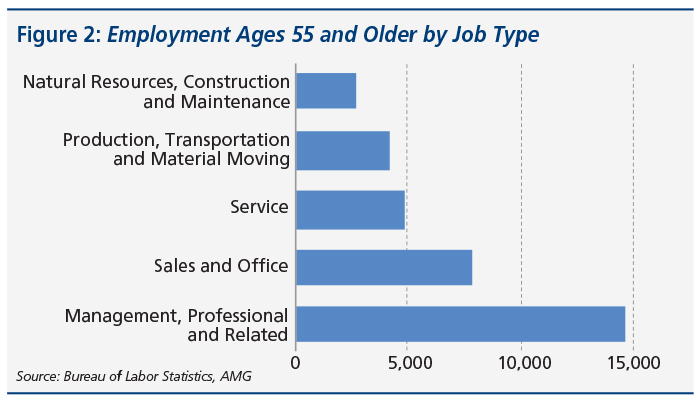
If keeping people in the work force longer is the goal, the process is a matter of increasing incentives. With increased life expectancy comes an increased working timeline, which might suggest policies that raise the age to collect Social Security benefits. A more politically feasible option may be to introduce tax incentives for working beyond a certain age akin to the Earned Income Tax Credit (EITC), but only for those past retirement age. There are many such incentive schemes that could be put into place to keep older workers in the labor force. However, retirement is inevitable, and extending the baby-boomer generation’s stay in the workforce for several more years may keep younger workers from good jobs given the number of professional and managerial roles baby-boomers hold (Figure 2). Therefore, it’s important to focus on the long-term trends in the labor force that need to be addressed, which will be discussed in the
following sections.
WOMEN
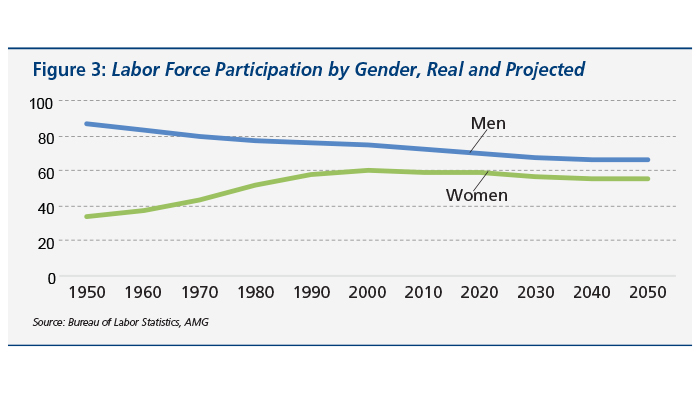
During the second half of the 20th century, women flocked to the labor force as cultural norms and discriminatory practices changed, boosting women’s LFPR to a peak of 60% in 1999, up from 33.9% in 1950. Since 1999, however, the rate has been declining. In 2005, women’s LFPR dropped to 59.3%, and is projected to decrease to 55.1% by 2050 (Figure 3).
This decline should not be taken lightly. Most of the gains in household income in the United States since 1970 were due to women’s increased presence in the workforce. Working women played a huge role in the productivity gains seen throughout the 1980’s and 1990’s. In fact, estimates suggest that the economy is $2 trillion, or 13.5%, larger than it would have been if women had kept working at the 1970’s rate.
Women’s LFPR and Children
One major issue affecting women’s status in the labor force is childrearing. Much of the decline in women’s LFPR in recent years is due to new mothers leaving the workforce and never returning. While motherhood may mitigate the natural maximum of women’s LFPR, recent evidence from Japan suggests that there may be policy initiatives that can effectively pull prime-age mothers back into the workforce.
For 40 years, Japan’s prime-age female LFPR lagged the United States. But in 2016, Japan caught and surpassed the United States’ prime-age female LFPR. Many of the jobs that boosted this rate were part-time and non-regular, yet the effect on growth was still substantial. Holding quality of job constant, if the United States had matched Japan’s female LFPR, U.S. GDP would have increased by around $800 billion (4%). It is also possible that the part-time and non-regular work taken by Japanese women during this period was due to increased desire for flexibility, which may be more highly valued among women with children.
This change for Japanese women was large and fast. Much of the gains made by Japan, and the losses felt in the United States, were those of women in their twenties and thirties. Japanese women in this age group have increased participation in every cohort since 1977, while in the United States, women in this group became less likely to work than previous cohorts. Relatedly, a large subset of the increase in Japan’s female LFPR resulted from increasing the married female participation rate, which soared from 58% in 2000 to 71% in 2016. Meanwhile, the married female participation rate in the United States trended downward, as did never-married and divorced.
During the last three decades, Japan has implemented several key policy changes to support working mothers. Japanese mothers have access to government-mandated paid leave for new parents, and the government has made substantial efforts in the past twenty years to increase access to government daycare facilities.
Prime minister Shinto Abe has also recently introduced a set of policies dubbed “womenonomics,” which includes lower tax rates for married women, better family leave and even more access to daycare facilities, all of which has been shown to increase the likelihood of mothers going back to work. It seems that Japan has realized the value in keeping women in the workforce, and that the way to do it is by supporting both work and childrearing.
Policy Implications for Women
The United States could benefit from the changes Japan has put into place to boost female LFPR. Japan’s past and continued support of childrearing through paid parental leave, increased access to daycare and tax cuts for married working women have allowed them to surpass the United States in working women. The downward trend will not change, and will likely be exacerbated, unless America’s policymakers take note of what is important to women in the workforce and act on it. If the United States could match the female labor force growth rate it had in the 1990’s, that alone would boost the overall labor force growth rate above 1% from the projected 0.7%, a major improvement.
PRIME-AGE MEN
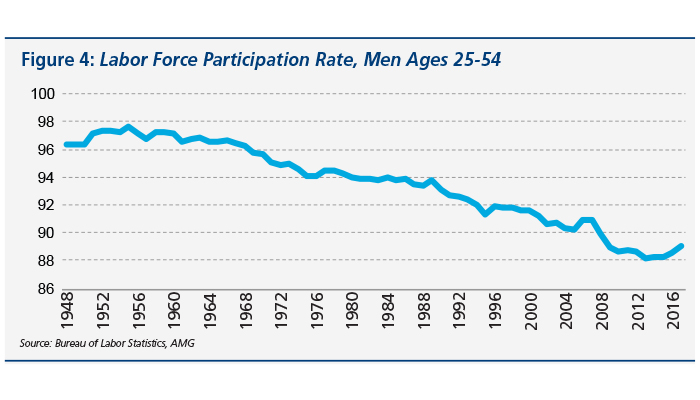
The future for labor force participation of prime-age men in the United States looks bleak. The LFPR for prime-age men in the United States peaked in 1954 at 98%, about ten years after the statistic’s inception. Since then, the LFPR for prime-age men has been on a downward trajectory that is expected to continue for the foreseeable future, and now stands at 88% (Figure 4).
The fact that the downward trend for prime-age men has been so longstanding makes the problem nearly inextricable, and there are many possible explanations. To break the problem down into simpler terms, one must consider both the supply side and the demand side of the labor force. That is, whether the labor market is not providing jobs for this group (demand side), or that inactive prime-age men do not want the jobs available (supply side).
Demand-Side Issues for Prime-Age Men
Increasing job polarization in the U.S. labor market has nearly mirrored the decline in the prime-age male participation rate. The number of jobs for high- and low-skilled workers has increased, while the number for middle-skilled workers has dwindled. Middle-skilled workers are those without a bachelor’s degree, but with some vocational training whether formal or on the job.
From 1996 to 2016, the share of middle-skill occupations in the United States decreased from nearly 55% to around 43%. Meanwhile, high-skill jobs increased from nearly 32% to 39%, and low-skill jobs increased from just over 14% to just over 18% (Figure 5). During the same time period, the number of unemployed prime-age men rose from 4.6 million to 7.1 million, an increase of 2.5 million.
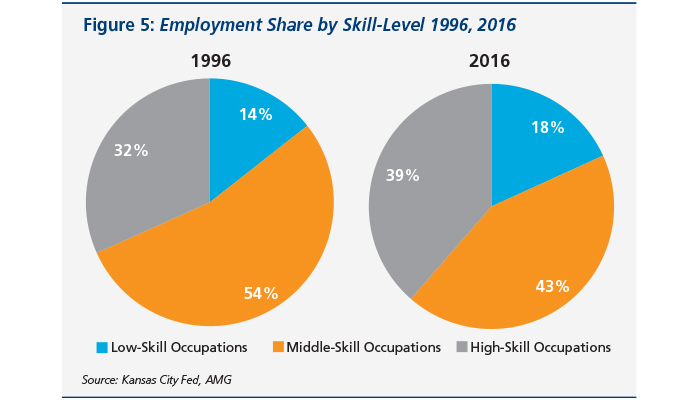
Many of the middle-skill jobs lost were in production or manufacturing, where prime-age men disproportionately were employed. In 1996, almost 60% of all prime-age men were employed in middle-skill occupations. By 2016, this number had decreased by nearly 9%. Some of the men previously employed in these middle-skill jobs transitioned into high- or low-skill jobs; however, the evidence suggests that most dropped out of the labor force entirely. In fact, estimates show that if the skill composition of jobs had not changed during this twenty-year period, almost two million men would have been employed that quit working instead. This means that of the 2.5 million-man increase in inactivity from 1996 to 2016, 80% could be employed if the labor market had not shifted away from middle-skill occupations. It should also be noted that this reduction is only within the past 25 years, and the number of available middle-skill jobs for the period after 1948 and before 1996 was even higher.
Supply-Side Issues for Prime-Age Men
Do prime-age men want a job? That is the labor supply issue. The Current Population Survey (CPS) asked this question to prime-age inactive men in the United States in 1993. The results showed 23% saying they definitely wanted a job, 2% saying they might want a job, and an amazing 70% saying they definitely did not want a job. Overall, the CPS found that the proportion of prime-age inactive men who want a job peaked at 28% in 1985 and stood at 16% in 2015. Thus, the share of inactive men who want a job is now lower than it was in 1993.
Job polarization is undoubtedly part of the explanation for the decline in the LFPR, but the decline in the desire for work among prime-age men cannot be ignored. There are two big changes over the last 50 years that may help explain a decrease in the desire for work: increased access to or desire for leisure and increased access to transfer payments in the form of disability benefits.
First, increased desire for leisure potentially explains the decrease in prime-age men’s desire to work. Time-use surveys show that the amount of time spent on leisure by prime-age men without a college degree has increased rapidly since 1993, likely due to advancements in technology. For example, one study conducted between 2000 and 2015 found a substantial four-hour per week increase in leisure for men in their twenties without a college degree was almost entirely due to videogaming.1 The same study found that the self-reported happiness of these young men rose over this period. This study implies that technological advancements over the last 50 years may have had a substantial effect on the desire to work for prime-age men. However, decreased desire for work may not necessarily be entirely due to the increased amounts of leisure that inactive prime-age men are experiencing. Some of these men are enrolled in school, which could be an alternative reason why they would not want a job.
A second reason that more prime-age men are out of work than ever before may be due to increased access to disability benefits. Research shows that the rising number of ill and disabled prime-age men accounts for nearly 50% of the increase in prime-age male inactivity from 1968 to 2014. Another study found that the growth in the number of prime-age men receiving government disability benefits accounted for nearly 40% of the increase in inactivity among prime-age males from 1970 to 2013.2
Over the past 50 years, occupational safety, life expectancy and most other measures of worker health have increased, while the number of prime-age men receiving and claiming disability benefits has skyrocketed. According to the CPS, of the prime-age employed men who are absent during the work week, the majority giving health problems as a reason for their absence fell from 50% in 1962 to 24% in 2014. Meanwhile, working rates for the disabled have continued to fall and the number of Americans receiving disability benefits has increased almost three-fold in the last 20 years.3 Those applicants with the least serious ailments are 120% more likely to return to work if they do not receive Social Security Disability Insurance (SSDI) than if they do.4
An SSDI beneficiary makes close to minimum-wage and receives Medicare, while low-skill wages are stagnant and the work is often not enviable, which may create incentives to seek SSDI. Seventy-five percent of all inactive men live in a household that received some sort of transfer income in the last year, but the rate of household transfer receipt for disabled-inactive men was 90%. That is, only 10% of inactive men who claim disability as the reason for inactivity did not receive any type of transfer income in the past year.2
Policy Implications for Prime-Age Men
Even though prime-age male labor force participation has been on the decline for so long, and is predicted to keep declining, there still may be policy changes that could help alleviate the descent.
The issue of job polarization can be directly mitigated in two ways. The first possibility is to train middle-skilled men to become highly-skilled through education programs. The second possibility, and more short-term of the two, is to provide middle-skill jobs through infrastructure projects or something similar. The incentives would be harder to adjust appropriately for the second option given the supply-side issues and the prevalence of disabled men in the prime-age inactive group. Given this limitation, increasing access to and incentivizing education and training is more likely to be a successful path in addressing job-polarization. Men in the United States lag U.S. women and men in many other world powers in educational attainment, so there is much room for improvement in this area.(4) Additionally, disabled men are more than twice as likely than non-disabled men to have less than a high school diploma. Given the connection between disability and inactivity, education should be a priority. If even half of the 10 million prime-age inactive men could be trained for highly-skilled positions, it would boost the labor force growth rate to over 1% from the projected 0.7%, a substantial increase that would have a major impact on GDP.
More broadly, improving the demand-side issues could be done by boosting aggregate demand in the economy and focusing on growth. More and better jobs that pay well could help to pull people off the sidelines. Monetary policy that prioritizes growth could be coupled with some broad incentives for work like boosting the EITC, which may help lower-skilled women as well.
Addressing the supply-side issues of prime-age men requires incentivizing work. A primary component of the issue is the receipt of disability benefits, which studies suggest has been responsible for much of the inactivity over the last 50 years despite a generally healthier population. Reforms that encourage independence, self-sufficiency and return to work could help mitigate declines due to receipt of disability benefits. This would be no trivial change, as marginal candidates (e.g. individuals with muscular issues or mental health issues) make up a quarter of all applicants for SSDI. Another area of reform might be in the appeals process (which allows third-parties to overturn initial SSDI rejections) by which half of beneficiaries now receive support.(3)
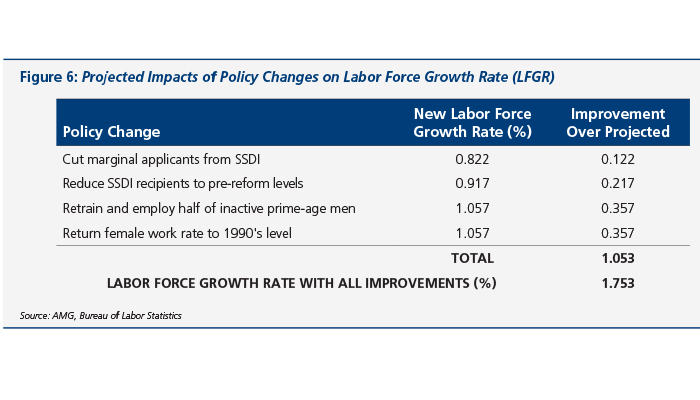
AMG’s calculations show that reducing the share of the population receiving SSDI to the pre-reform levels alone could boost the labor force growth rate from the projected 0.7% to almost 1%, assuming a 50% work rate for denied applicants (Figure 6). This change could have a much more substantial effect considering that more than 50% of denied applicants might return to work.
 GROWTH IMPLICATIONS
Productivity growth is projected to be 1.3% over the next decade. With a projected LFGR of 0.7%, this sums to annual GDP growth of 2%. This projected level of growth is more than a full percentage point lower than the 50-year average of 3.3%. If the changes we have outlined in this white paper were to be implemented and the labor force growth rate could rise to 1.753%, this would potentially boost annual GDP growth to 3.053%. This rate is still lower than the 50-year average, but far more desirable than the projected 2%. These calculations signify the importance of getting American workers off the sidelines. Without major gains in productivity or labor over the next decade, the United States will be destined for mediocre levels of growth. With so much talent currently out of the workforce, re-training, re-skilling and incentivizing American workers to come back to work should be the priority for sustained growth.
INVESTMENT IMPLICATIONS
Ultimately, the United States will need to incentivize some combination of the 10 million prime-age men who are out of the labor force, women and the aging baby-boomer generation to create the additional 12 million workers needed to boost the labor growth rate to its historical high. We believe this is the best way for the United States to sustain a growth rate above 3% over the coming decades without major increases in productivity.
Despite these negative trends in the labor force, AMG is optimistic about American economic growth. The Trump administration has made efforts in job training and re-skilling programs, including the reauthorization of the Strengthening Career and Technical Education (CTE) for the 21st Century Act, which provides over $1 billion dollars through 2024 to aid on-the-job training programs. The administration’s National Council for the American Worker has also received pledges from private-sector firms including WalMart, Home Depot, General Motors and Microsoft to train workers in skills needed for 21st century jobs. These efforts are expected to help fill 3.7 million jobs in the United States. In addition, the recent tax cuts have encouraged capital inflows to the United States and domestic business investment, which will likely boost aggregate demand and create more jobs.
AMG believes that the United States has the opportunity to remain the world’s economic leader and that investments in American business will continue to perform well over the long run. If the United States can learn from other countries how to grow and improve the labor force through policy changes and continue job-training efforts and incentives to work for men and women, the U.S. economic position will only improve.